CEPH Troubleshooting
This is not official documentation for AutomationSuite
Identify if CEPH is unhealthy
If ceph objectstore is not consumable , the dependent application will become unhealthy. You can run below command to identify Unhealthy Pods in the system
kubectl get pod -A -o wide | grep --color -P '([0-9])/\1|Completed' -v
Tools required for debugging
-
rook-ceph-tools
-
s3cmd (one can use sf-k8-utils-rhel to spawn a temp pod for s3cmd)
-
Run these commands on any server node
OBJECT_GATEWAY_INTERNAL_IP="rook-ceph-rgw-rook-ceph"
OBJECT_GATEWAY_INTERNAL_HOST=$(kubectl -n rook-ceph get services/$OBJECT_GATEWAY_INTERNAL_IP -o jsonpath="{.spec.clusterIP}")
OBJECT_GATEWAY_INTERNAL_PORT=$(kubectl -n rook-ceph get services/$OBJECT_GATEWAY_INTERNAL_IP -o jsonpath="{.spec.ports[0].port}")
STORAGE_ACCESS_KEY=$(kubectl -n rook-ceph get secret ceph-object-store-secret -o json | jq '.data.OBJECT_STORAGE_ACCESSKEY' | sed -e 's/^"//' -e 's/"$//' | base64 -d)
STORAGE_SECRET_KEY=$(kubectl -n rook-ceph get secret ceph-object-store-secret -o json | jq '.data.OBJECT_STORAGE_SECRETKEY' | sed -e 's/^"//' -e 's/"$//' | base64 -d)
echo "export AWS_HOST=$OBJECT_GATEWAY_INTERNAL_HOST"
echo "export AWS_ENDPOINT=$OBJECT_GATEWAY_INTERNAL_HOST:$OBJECT_GATEWAY_INTERNAL_PORT"
echo "export AWS_ACCESS_KEY_ID=$STORAGE_ACCESS_KEY"
echo "export AWS_SECRET_ACCESS_KEY=$STORAGE_SECRET_KEY" -
Spin a pod with s3cmd installed
sf_utils=$(kubectl get pods -n uipath-infra -o jsonpath="{.items[*].spec.containers[*].image}" | tr -s '[[:space:]]' '\n' | sort | uniq | grep sf-k8-utils | head -1)
[[ -z "${sf_utils}" ]] && echo "Unable to get sf_utils image , Please set the image manually 'sf_utils=<IMAGE_NAME>'"

  if [[ -n "${sf_utils}" ]]; then
  cat > /tmp/dummy-pod-s3cmd.yaml << 'EOF'
  apiVersion: v1
  kind: Pod
  metadata:
  name: s3cmd
  namespace: uipath-infra
  spec:
  containers:
  - image: __IMAGE_PLACEHOLDER__
      imagePullPolicy: IfNotPresent
      command: ["/bin/bash"]
      args: ["-c", "tail -f /dev/null"]
      name: rclone
      resources: {}
      terminationMessagePath: /dev/termination-log
      terminationMessagePolicy: File
      securityContext:
      allowPrivilegeEscalation: false
      capabilities:
          drop:
          - ALL
          - NET_RAW
      privileged: false
      readOnlyRootFilesystem: true
      runAsGroup: 1
      runAsNonRoot: true
      runAsUser: 1
      volumeMounts:
      - mountPath: /.kube
      name: kubedir
  volumes:
  - emptyDir: {}
      name: kubedir
  dnsPolicy: ClusterFirst
  enableServiceLinks: true
  restartPolicy: Always
  schedulerName: default-scheduler
  securityContext: {}
  terminationGracePeriodSeconds: 30
  EOF
  sed -i "s;__IMAGE_PLACEHOLDER__;${sf_utils};g" /tmp/dummy-pod-s3cmd.yaml
  kubectl apply -f  /tmp/dummy-pod-s3cmd.yaml
fi- Login to the s3cmd pod
kubectl -n uipath-infra exec -it s3cmd -- bash- copy/paste output of first step into the s3cmd pod console, output of first command will look similar to this
export AWS_HOST=10.43.89.191
export AWS_ENDPOINT=10.43.89.191:80
export AWS_ACCESS_KEY_ID=xxxx
export AWS_SECRET_ACCESS_KEY=xxxx -
Query CEPH via s3cmd
Install s3cmd client,
sudo pip3 install s3cmd
To access ceph internally,
OBJECT_GATEWAY_INTERNAL_IP="rook-ceph-rgw-rook-ceph"
OBJECT_GATEWAY_INTERNAL_HOST=$(kubectl -n rook-ceph get services/$OBJECT_GATEWAY_INTERNAL_IP -o jsonpath="{.spec.clusterIP}")
OBJECT_GATEWAY_INTERNAL_PORT=$(kubectl -n rook-ceph get services/$OBJECT_GATEWAY_INTERNAL_IP -o jsonpath="{.spec.ports[0].port}")
STORAGE_ACCESS_KEY=$(kubectl -n rook-ceph get secret ceph-object-store-secret -o json | jq '.data.OBJECT_STORAGE_ACCESSKEY' | sed -e 's/^"//' -e 's/"$//' | base64 -d)
STORAGE_SECRET_KEY=$(kubectl -n rook-ceph get secret ceph-object-store-secret -o json | jq '.data.OBJECT_STORAGE_SECRETKEY' | sed -e 's/^"//' -e 's/"$//' | base64 -d)
export AWS_HOST=$OBJECT_GATEWAY_INTERNAL_HOST
export AWS_ENDPOINT=$OBJECT_GATEWAY_INTERNAL_HOST:$OBJECT_GATEWAY_INTERNAL_PORT
export AWS_ACCESS_KEY_ID=$STORAGE_ACCESS_KEY
export AWS_SECRET_ACCESS_KEY=$STORAGE_SECRET_KEY
to access ceph externally,
OBJECT_GATEWAY_EXTERNAL_HOST=$(kubectl -n rook-ceph get gw rook-ceph-rgw-rook-ceph -o json | jq -r '.spec.servers[0].hosts[0]')
OBJECT_GATEWAY_EXTERNAL_PORT=31443
export AWS_HOST=$OBJECT_GATEWAY_EXTERNAL_HOST:$OBJECT_GATEWAY_EXTERNAL_PORT
export AWS_ENDPOINT=$OBJECT_GATEWAY_EXTERNAL_HOST:$OBJECT_GATEWAY_EXTERNAL_PORT
export AWS_ACCESS_KEY_ID=$STORAGE_ACCESS_KEY
export AWS_SECRET_ACCESS_KEY=$STORAGE_SECRET_KEY
Sample commands to query ceph,
s3cmd ls --host=${AWS_HOST} --no-check-certificate --no-ssl
s3cmd mb --host=${AWS_HOST} --host-bucket=  s3://test-bucket --no-ssl
s3cmd put data.csv --no-ssl --host=${AWS_HOST} --host-bucket=  s3://training-18107870-86eb-4c36-a40c-62bf77c9120c/4c56d172-6b52-409b-9308-75f1e8dd6418/9f3e2c75-782a-4735-85f0-461714cbcba0/dataset/data.csv
s3cmd get s3://rookbucket/rookObj --recursive --no-ssl --host=${AWS_HOST} --host-bucket=  s3://rookbucket
s3cmd ls s3://training-05d99a71-f0ca-4bfe-9a0c-8ebe09b0ddb8/ --host=${AWS_HOST} --host-bucket=  s3://training-05d99a71-f0ca-4bfe-9a0c-8ebe09b0ddb8/ --no-ssl
Query Size of the Buckets
- log into ceph tools pod
kubectl -n rook-ceph exec -it $(kubectl -n rook-ceph get pods | grep rook-ceph-tools | cut -d ' ' -f1) bash
- Query bucket sizes
for bucket in $(radosgw-admin bucket list | jq -r '.[]' | xargs); do radosgw-admin bucket list --bucket=$bucket | jq -r '.[] | .name' | grep shadow | wc -l;done
Query size of buckets using s3cmd
Spin an s3cmd pod and export CEPH credentials by following steps under the section ToolsRequiredForDebugging
Now we can query the size of buckets,
s3cmd du -H s3://testbucket --host=${AWS_HOST} --no-check-certificate --no-ssl --host-bucket=  s3://testbucket
s3cmd du -H s3://sf-logs --host=${AWS_HOST} --no-check-certificate --no-ssl --host-bucket=  s3://sf-logs
s3cmd du -H s3://train-data --host=${AWS_HOST} --no-check-certificate --no-ssl --host-bucket=  s3://train-data
s3cmd du -H s3://uipath --host=${AWS_HOST} --no-check-certificate --no-ssl --host-bucket=  s3://uipath
s3cmd du -H s3://ml-model-files --host=${AWS_HOST} --no-check-certificate --no-ssl --host-bucket=  s3://ml-model-files
s3cmd du -H s3://aifabric-staging --host=${AWS_HOST} --no-check-certificate --no-ssl --host-bucket=  s3://aifabric-staging
s3cmd du -H s3://support-bundles --host=${AWS_HOST} --no-check-certificate --no-ssl --host-bucket=  s3://support-bundles
s3cmd du -H s3://taskmining --host=${AWS_HOST} --no-check-certificate --no-ssl --host-bucket=  s3://taskmining
Query No of Objects Pending garbage collection
for bucket in $(radosgw-admin bucket list | jq -r '.[]' | xargs); do radosgw-admin bucket list --bucket=$bucket | jq -r '.[] | .name' | grep shadow | wc -l;done
Note: shadow object are those objects that have been deleted, but not garbage collected
Troubleshooting ceph
Ceph objecstore may become unavailable for a variety of reason, some of them are mentioned below
- OSDs are full
- Majority of OSDs are corrupted
- OSD pods are not in healthy state due initCrashloop
- Underlying block device is not available (either system level block device or LH provided block device)
- PGs are stuck in
- Incomplete
- Unfound
- Pending
As a general thumb rule start with ceph status,
kubectl -n rook-ceph exec deploy/rook-ceph-tools -- ceph status
If it shows something like below , cluster is healthy
  cluster:
    id:     0f9036e6-5ae0-4ff3-bdb1-853331280320
    health: HEALTH_OK

  services:
    mon: 3 daemons, quorum a,b,c (age 2h)
    mgr: a(active, since 2h), standbys: b
    osd: 3 osds: 3 up (since 2h), 3 in (since 2h)
    rgw: 2 daemons active (rook.ceph.a, rook.ceph.b)

  task status:

  data:
    pools:   8 pools, 81 pgs
    objects: 2.48k objects, 876 MiB
    usage:   5.6 GiB used, 762 GiB / 768 GiB avail
    pgs:     81 active+clean

  io:
    client:   252 KiB/s rd, 426 B/s wr, 251 op/s rd, 168 op/s wr
To understand specific warning or error,
kubectl -n rook-ceph exec deploy/rook-ceph-tools -- ceph health detail
If OSD are reporting full, check OSD capacity and storage space consumed by actual objects in cluster

kubectl -n rook-ceph exec deploy/rook-ceph-tools -- ceph osd df
Sometime for a delete heavy cluster , you may see huge different between the two values while OSDs may report full. This is classic case of slower GC where deleted objects are still occupying storage space
In case OSD is full , we have two options
-
Increase storage capacity of the cluster
-
By adding new OSD (Raw device backed OSDs)
-
By vertically scaling exiting OSD (PV backed OSDs)
-
Run GC manually. But to allow GC to cleanup the deleted objects , ceph cluster has to available for writes. When OSD become full, cluster becomes read-only. So to make cluster writable again , one can follow steps
- Get current full ratio
kubectl -n rook-ceph exec deploy/rook-ceph-tools -- ceph osd dump | grep ratio- Increase full ratio by 0.01
kubectl -n rook-ceph exec deploy/rook-ceph-tools -- ceph osd set-full-ratio <NEW_VALUE>- Run GC manually
kubectl -n rook-ceph exec deploy/rook-ceph-tools -- radosgw-admin gc process --include-all- Check ceph osd capacity to see if deleted objects are getting removed
- Reset the full ratio to original value
OSD(s) are crashing due to Init error
Ceph OSDs pod consists of Init containers and a main container. The job of init containers is to make sure everything is in place before main container starts. In this case, we see two init containers
- active (Make sure ceph lvm devices are active and ready to use)
- chown (Make sure data directory has correct permissions so that main container can access them using ceph user)

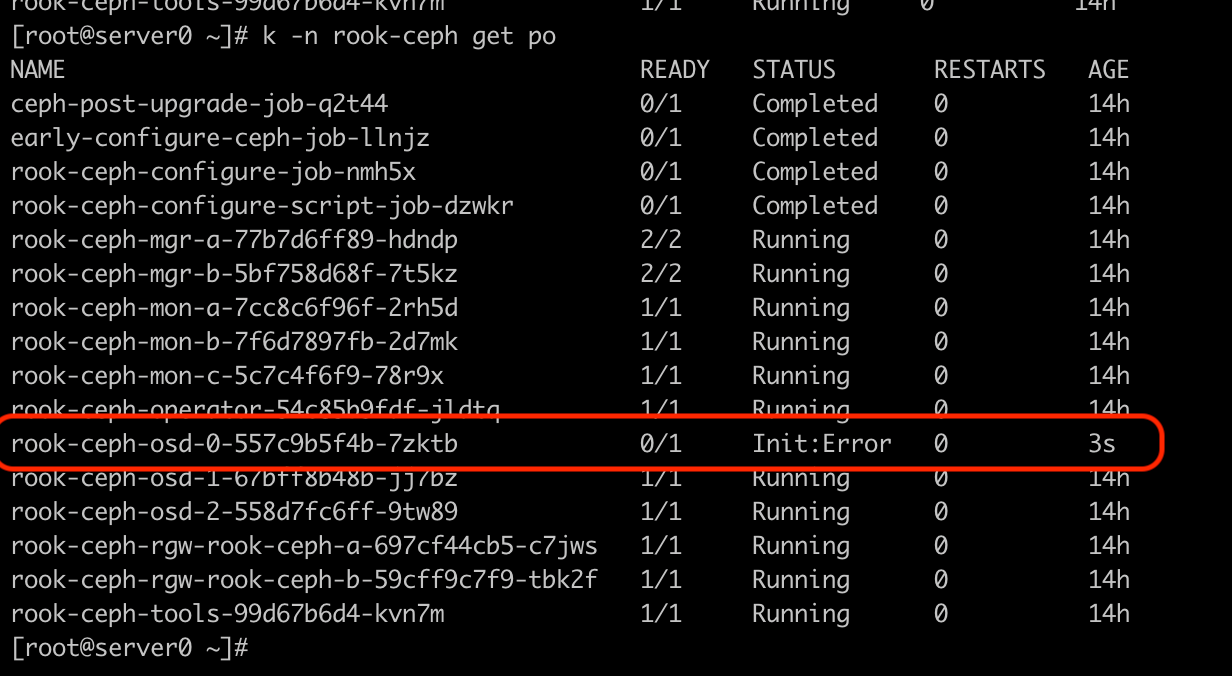
In such case , one needs to check logs of crashing init container. To do that , run below command
kubectl -n rook-ceph describe pod rook-ceph-osd-0-557c9b5f4b-7zktb

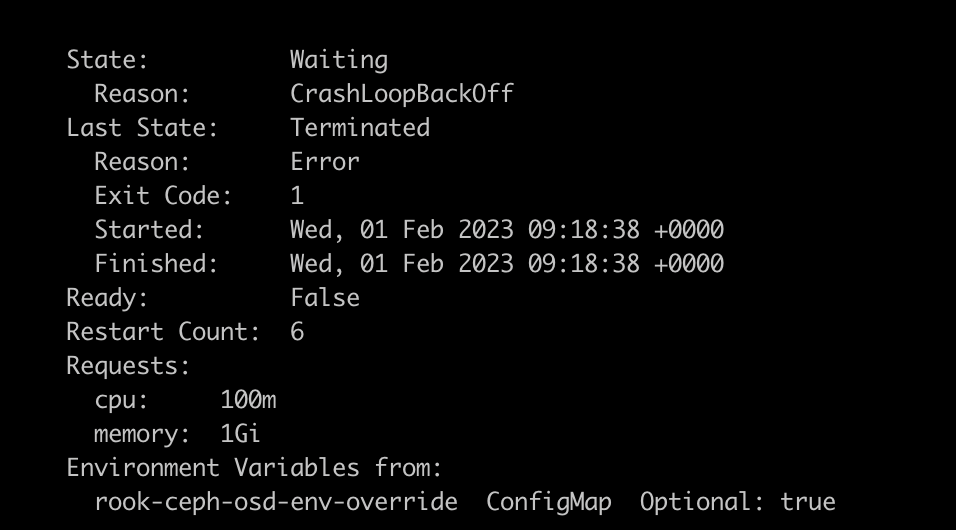
It will show which container is having the problem (in this case it is activate) and why it is in error/crashloop state (in this case it is exiting with code 1).
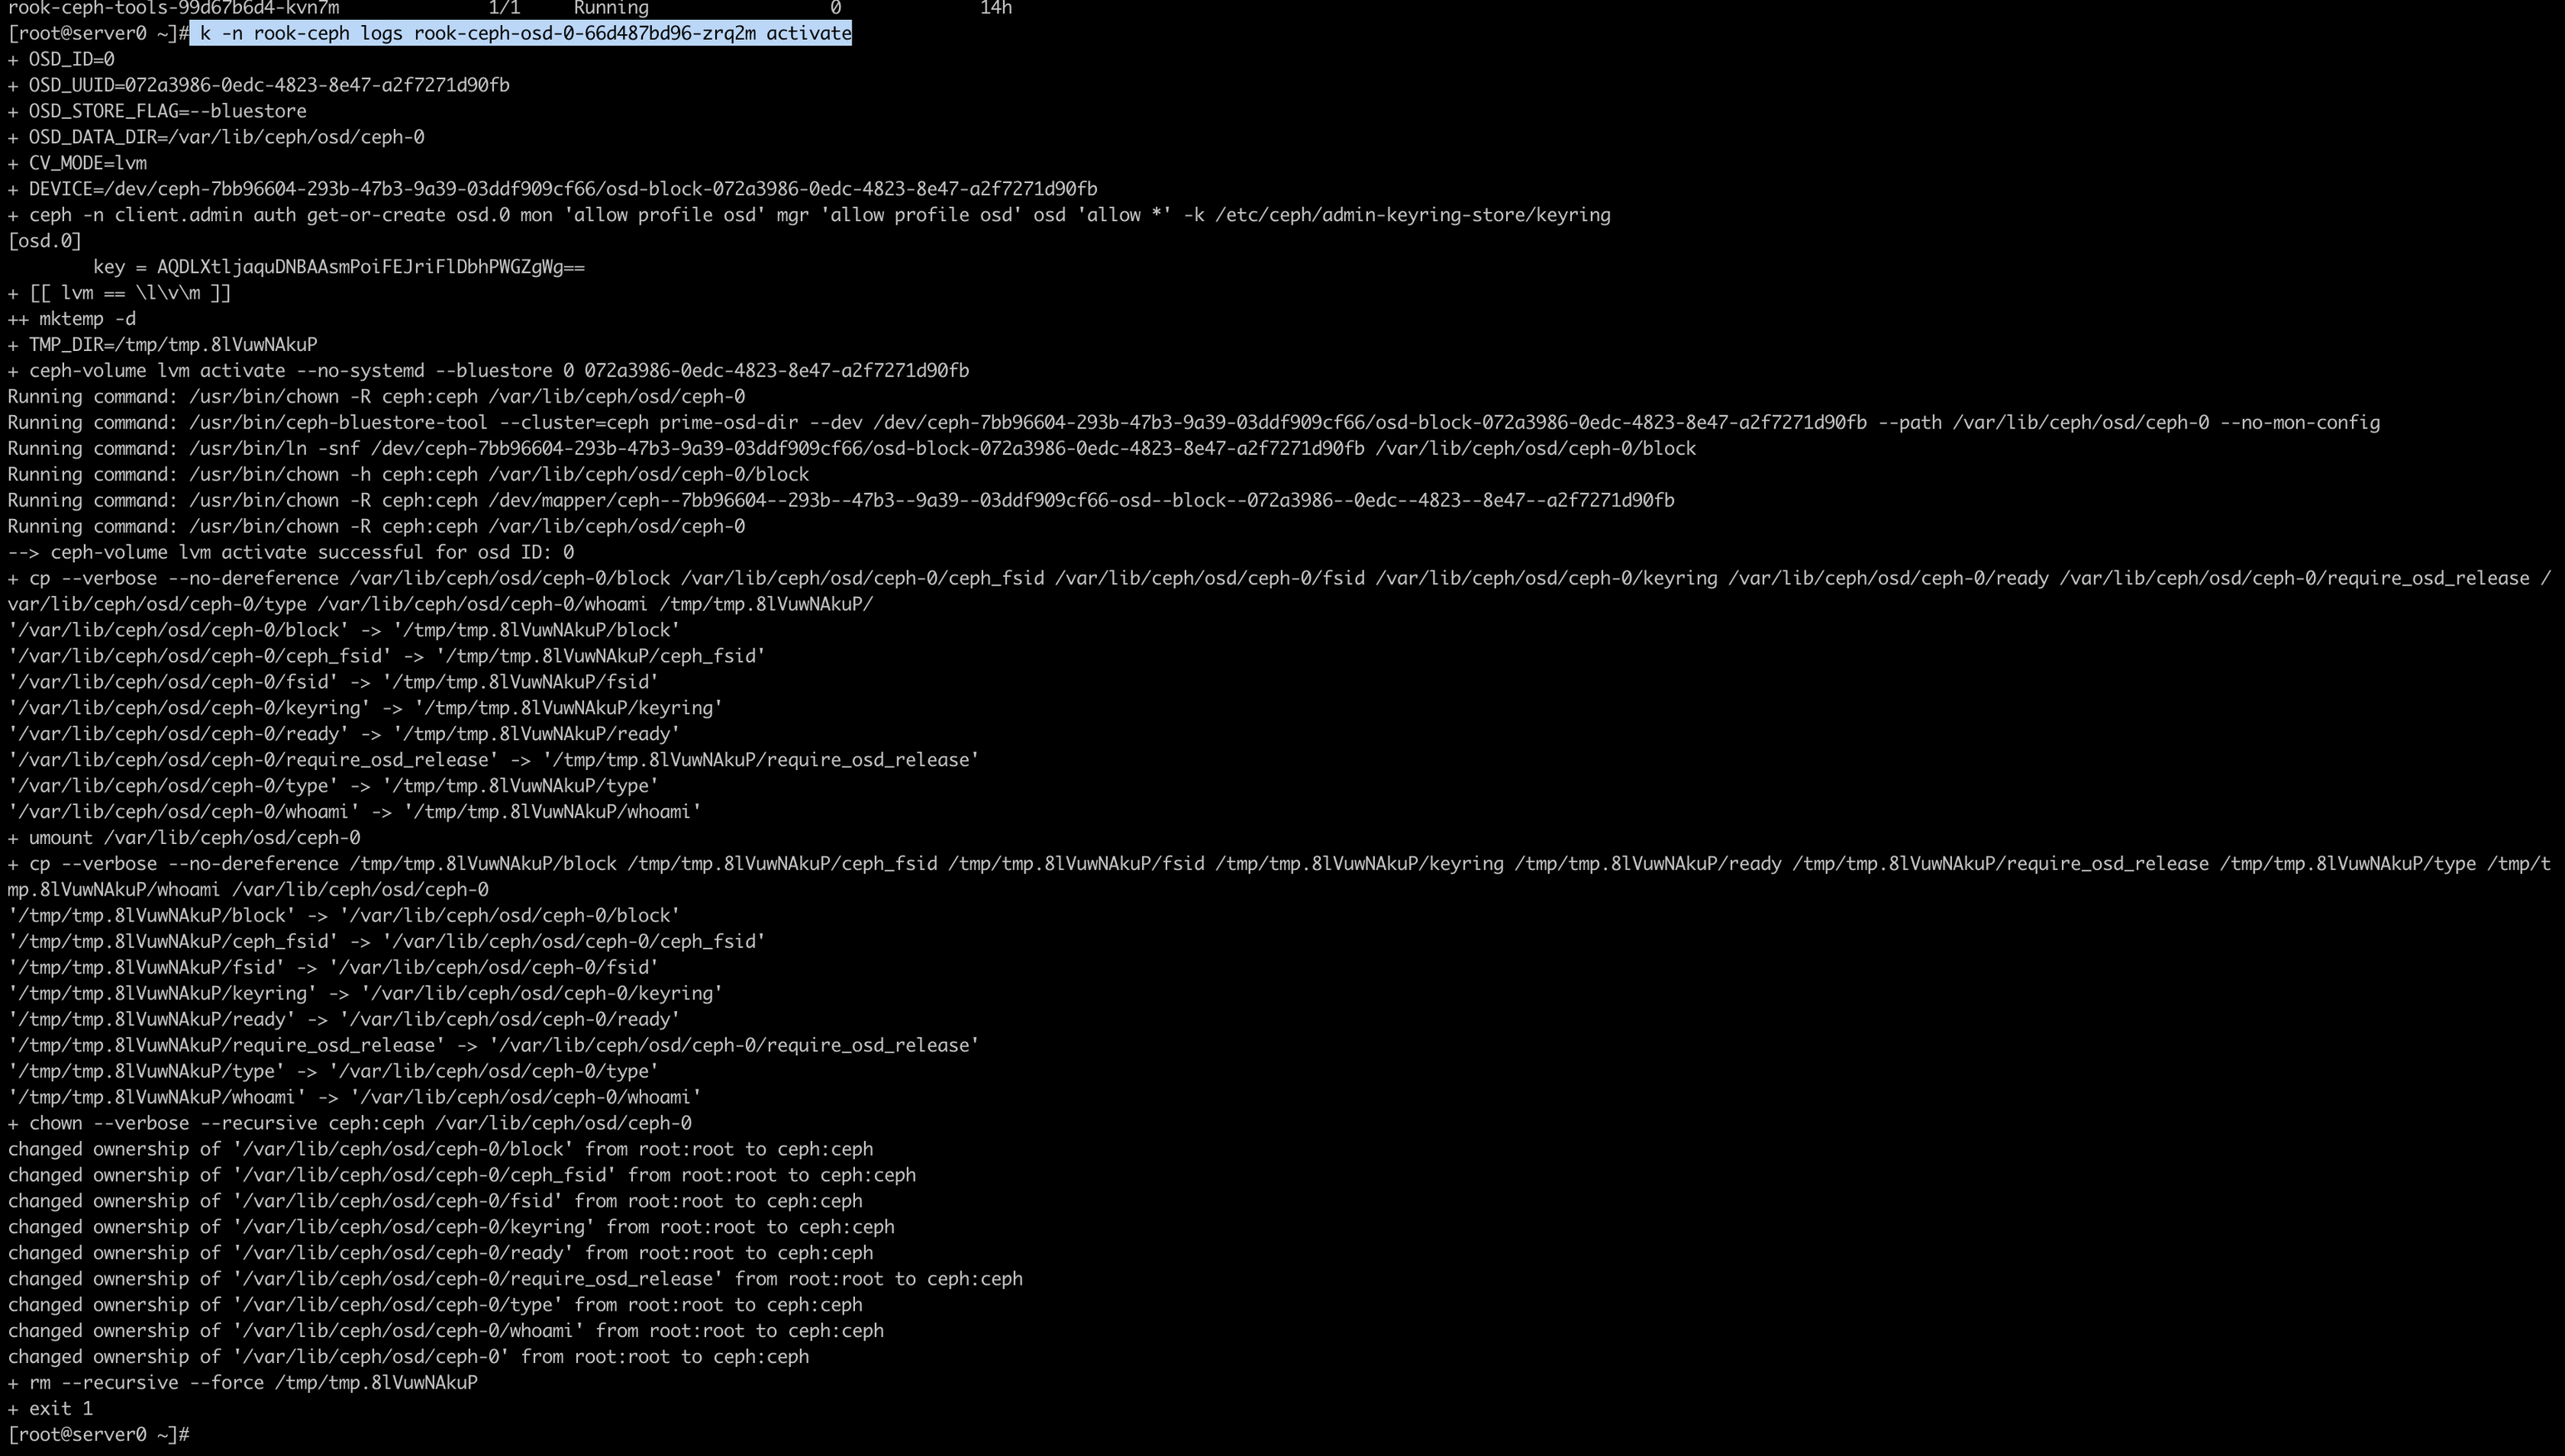
Now view the logs of crashing container run below command,
kubectl -n rook-ceph logs rook-ceph-osd-0-66d487bd96-zrq2m activate
PGs stuck in Incomplete state
Ceph PGs may get stuck in incomplete state and is not able to recover those PGs automatically. In such case, a manual intervention is required which would mark those PGs complete to make the objectstore usable
Below are steps to help achieve this
- Identify if PGs are stuck in incomplete state
kubectl -n rook-ceph exec deploy/rook-ceph-tools -- ceph status
Look for pgs section under data if some PGs are showing Incomplete state , it requires manual intervention to recover
- Find PGs ids stuck in incomplete state
kubectl -n rook-ceph exec deploy/rook-ceph-tools -- ceph pg dump | grep complete  -i
# output may look like below , first column is pg id

8.10         190                   0         0          0        0  39739825            0           0   314       314  incomplete  2023-02-01T12:37:53.280816+0000     212'314      212:731  [0,1,2]           0  [0,1,2]               0         0'0  2023-01-31T18:34:53.950866+0000              0'0  2023-01-31T18:34:53.950866+0000              0
8.11         155                   0         0          0        0  20483141            0           0   283       283  incomplete  2023-02-01T12:37:53.366529+0000     212'283      212:686  [0,2,1]           0  [0,2,1]               0         0'0  2023-01-31T18:34:53.950866+0000              0'0  2023-01-31T18:34:53.950866+0000              0
8.12         171                   0         0          0        0  33379955            0           0   321       321  incomplete  2023-02-01T12:37:53.297156+0000     212'321      212:825  [1,2,0]           1  [1,2,0]               1         0'0  2023-01-31T18:34:53.950866+0000              0'0  2023-01-31T18:34:53.950866+0000              0
8.13         152                   0         0          0        0  20308913            0           0   270       270  incomplete  2023-02-01T12:37:53.360517+0000     212'270      212:720  [2,1,0]           2  [2,1,0]               2
-
Disable self heal for rook operator and scale it down. Make sure no operator pod is running
- Find active primary (column after array for ACTING, in this case osd 0,1,2) for all the affected PGs
-
Edit one primary OSD at a time (Lets start with OSD 0)
- Before editing the OSD deployment , take backup of the live manifest
kubectl -n rook-ceph get deploy rook-ceph-osd-0 -o yaml > rook-ceph-osd-0.yaml- Edit OSD deployment to remove Probes and replace exiting command with a dummy command like
sleep infinityand wait for the pod to go into running state. - Mark those PGs complete one by one
kubectl -n rook-ceph exec deploy/rook-ceph-osd-0 -- ceph-objectstore-tool --data-path /var/lib/ceph/osd/ceph-0 --pgid <PG_ID> --op mark-complete
e.g
kubectl -n rook-ceph exec deploy/rook-ceph-osd-0 -- ceph-objectstore-tool --data-path /var/lib/ceph/osd/ceph-0 --pgid 8.10 --op mark-complete

# if you get below error
# Mount failed with '(11) Resource temporarily unavailable'
# it means the main OSD process is still running, make sure you edit OSD deployment
# correctly, so that the OSD resouece is available to run adhoc command- Once all the incomplete PGs are marked complete , reapply backed up manifest to revert the temporary changes
- Wait until the OSD join the cluster back
- Repeat the same for other PGs
PGs stuck in recovery_unfound state
Ceph PGs may get stuck in recovery_unfound state. This may lead ceph cluster to ERR state. To recover from such state follow steps mentioned below
- Find PGs stuck in recovery_unfound state
kubectl -n rook-ceph exec deploy/rook-ceph-tools -- ceph pg dump | grep -i 'recovery_unfound' - Find objects in unfound state
kubectl -n rook-ceph exec deploy/rook-ceph-tools -- ceph pg <PG_ID> list_unfound - Run revert to last known state
kubectl -n rook-ceph exec deploy/rook-ceph-tools -- ceph pg <PG_ID> mark_unfound_lost revert - Wait for those PGs to come out of
recovery_unfoundstate
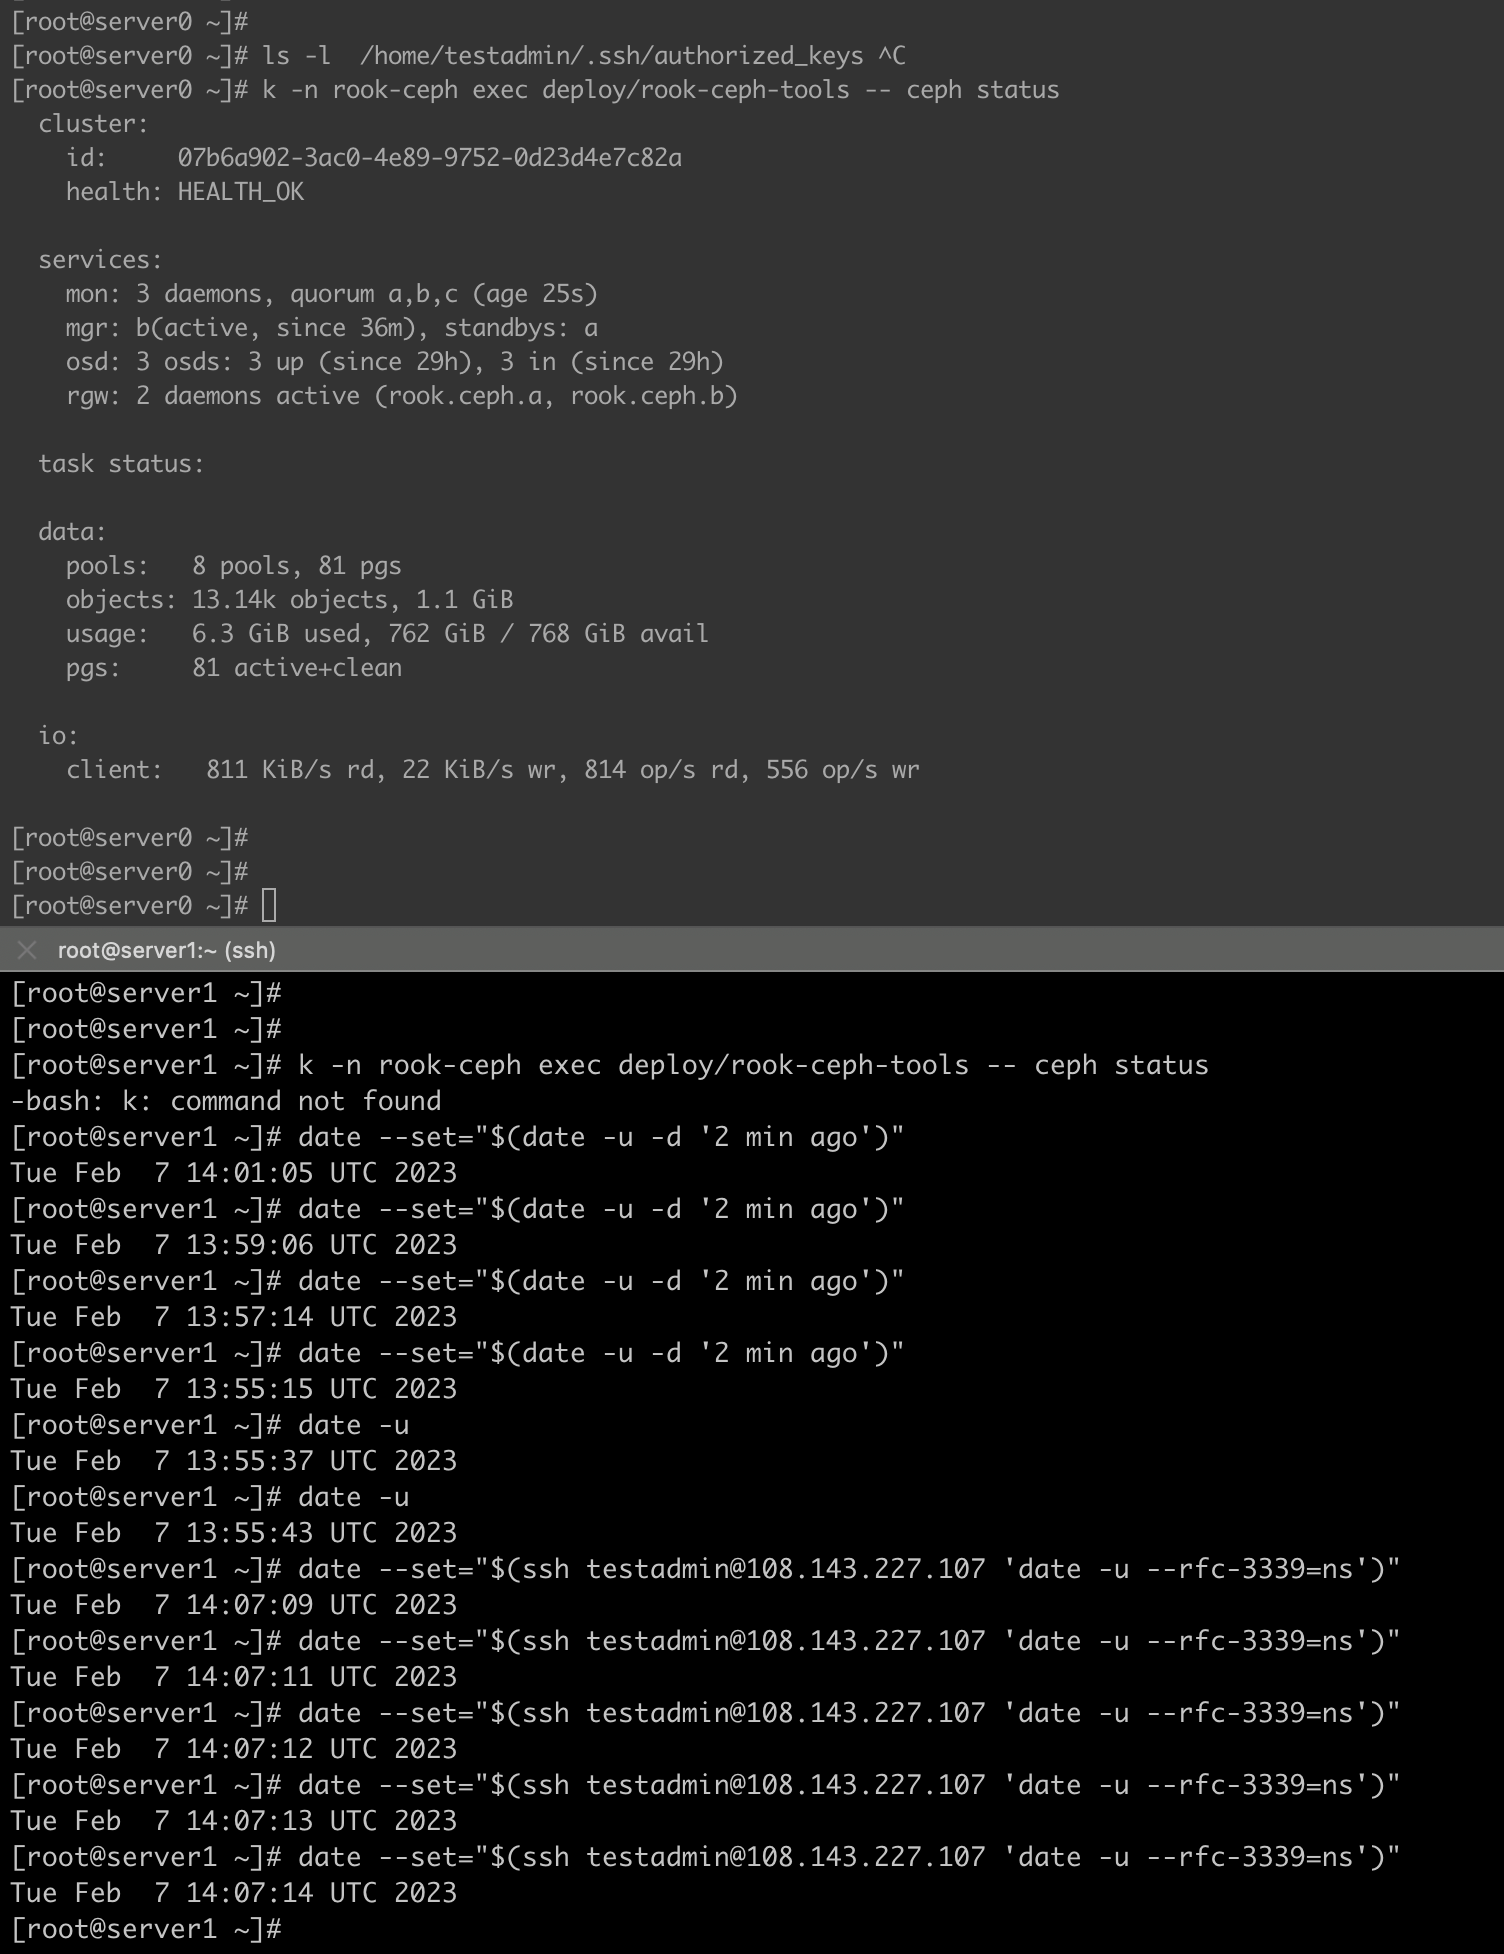
Clock skew in ceph cluster
- Use chronyd with external ntp server (Preferred but may not work for airgap/offline env)
- Use chronyd with first server as ntp server (Require
allowdirective in chrony config on to allow incoming sync request from other nodes)- On other nodes, use first servers IPs/hostname as NTP server
- Ensure UDP port designed for NTP (default: 123 ) is open among the nodes
- Use
timedatectlto check if time is getting synced - use
chronyc sourcesto check the ntp server being used by chrony service
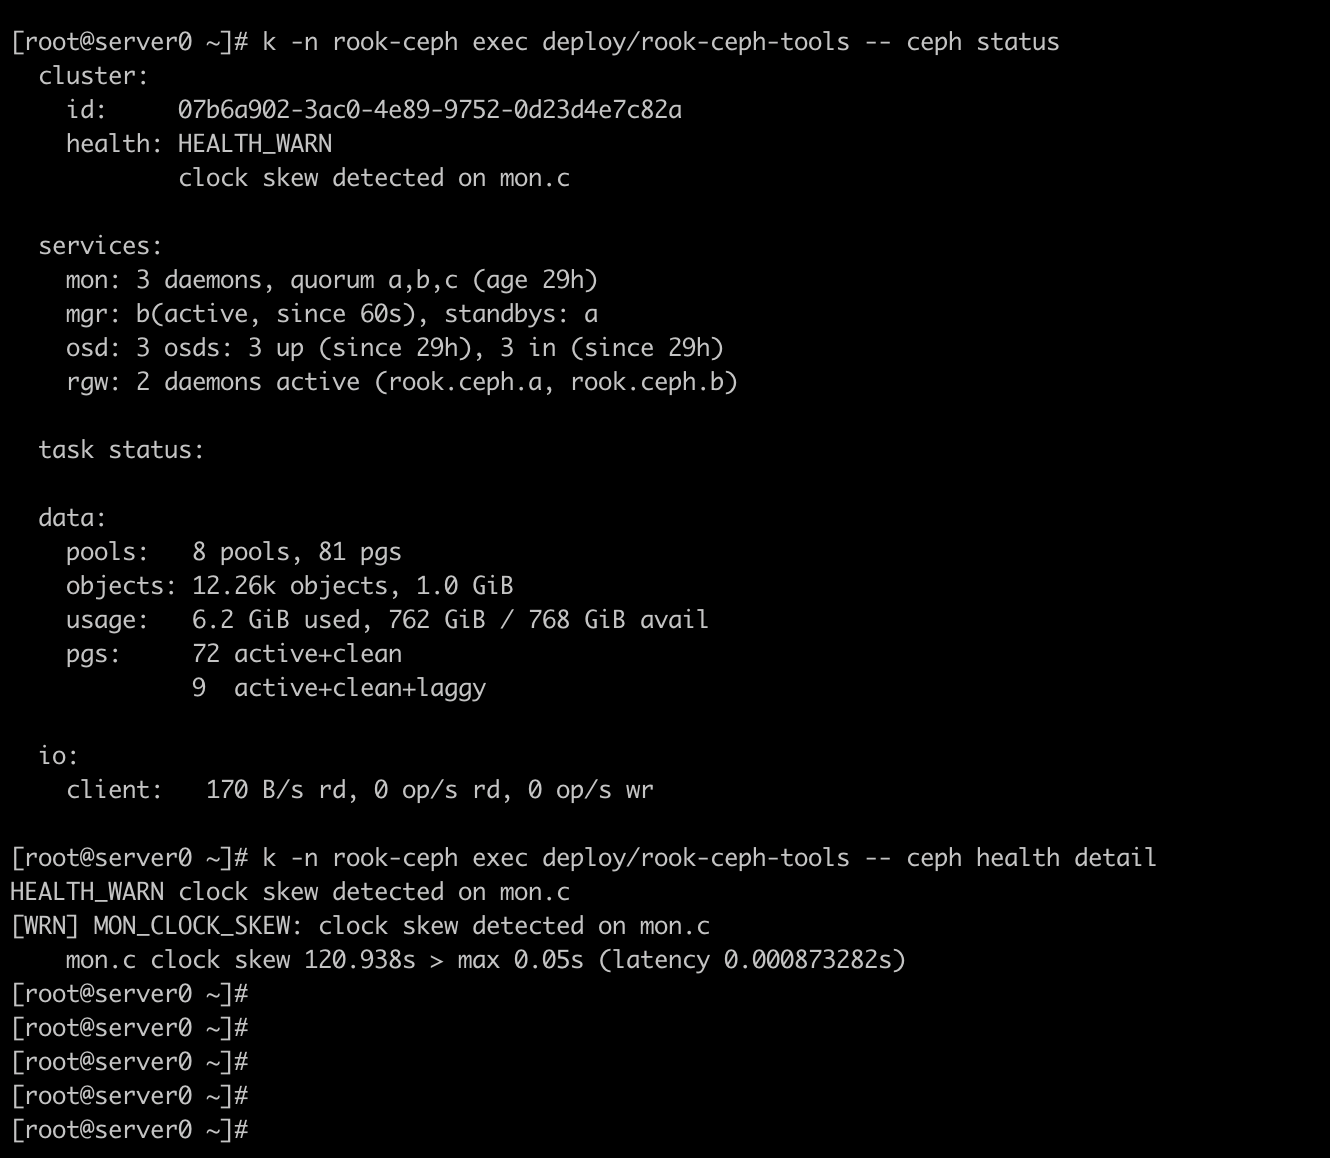
To fix clock skew , set clock to central server
Before fix,
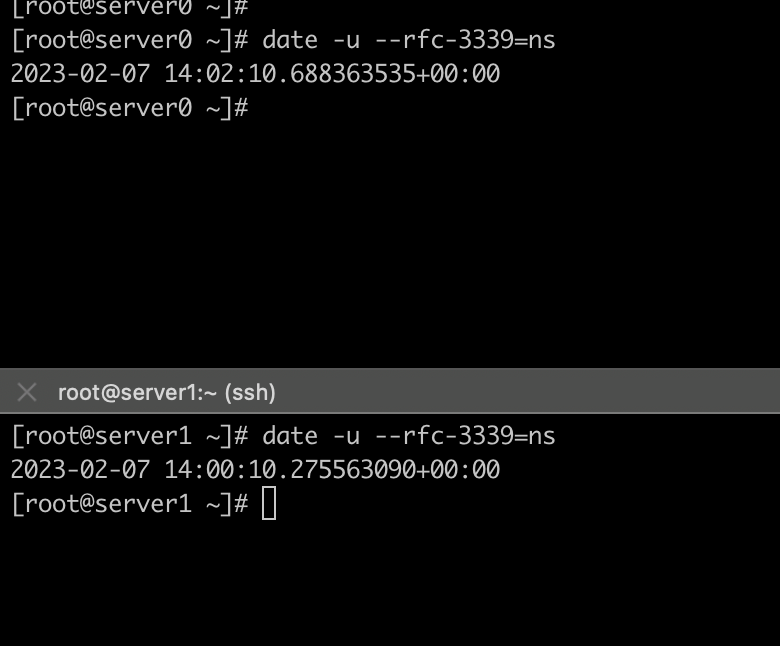
date --set="$(ssh <SSH_USER>@<CENTRAL_SERVER_IP> 'date -u --rfc-3339=ns')"
